


Published
New Zealand's road toll for 2025 was 270 deaths, according to provisional Ministry of Transport figures1. That is 5.1 deaths per 100,000 people2 and the fewest road deaths in a calendar year since 20133. In 2026, 255 people had died on New Zealand roads by 14 October (provisional), up from 216 at the same date in 20251.
Key facts
- 2025 road toll: 270 deaths in the 2025 calendar year (provisional)1.
- 2026 so far: 255 deaths from 1 January to 14 October 2026 (provisional), compared with 216 in the same period of 20251.
- Worst year on record: 843 people died on New Zealand roads in 19733.
- Change since the peak: the 2025 toll was about two-thirds lower than in 19733.
- Death rate: 5.1 road deaths per 100,000 people in 2025, the lowest rate since at least 19912.
- Christmas–New Year 2025/26: 10 deaths in the official holiday period, down from 15 in 2024/254.
- Holiday record: 37 deaths over the 1972/73 Christmas–New Year period, the highest since records began in 1956/575.
- Highest regional rate: Northland averaged almost 15 road deaths per 100,000 people a year in 2023–2025 (our calculation)6.
How many people died on New Zealand roads in 2025?
270 people died on New Zealand roads in 2025, according to the Ministry of Transport's provisional count1. That was 22 fewer than the 292 deaths recorded in 2024 and the lowest annual total since 2013, when 253 people died3.
The count is provisional and can fall after the year ends. A death is excluded if the crash was not on a public road, if a medical event such as a heart attack caused it, if it was a suicide or homicide, if no motor vehicle was involved, or if the person died more than 30 days after the crash7.
Most deaths happen on open roads with high speed limits. In 2025, 154 of the 270 deaths (57%) were on roads with a 100 km/h (62 mph) or 110 km/h (68 mph) speed limit, and 122 were on state highways1.
If you're planning to drive a hired campervan or motorhome in New Zealand, take most care on the open 100 km/h (62 mph) roads between towns.
| Road deaths in New Zealand by road type and speed limit, 2025 | |||
|---|---|---|---|
| Speed limit | Local roads | State highways | All roads |
| 30 km/h (19 mph) or less | 6 | 0 | 6 |
| 50 km/h (31 mph) | 47 | 12 | 59 |
| 60 km/h (37 mph) | 7 | 7 | 14 |
| 70 km/h (43 mph) | 1 | 4 | 5 |
| 80 km/h (50 mph) | 20 | 10 | 30 |
| 90 km/h (56 mph) | 0 | 2 | 2 |
| 100 km/h (62 mph) | 67 | 86 | 153 |
| 110 km/h (68 mph) | 0 | 1 | 1 |
| Total | 148 | 122 | 270 |
Source · Ministry of Transport, daily updated provisional road deaths, updated 14 October 2026. 2025 figures are provisional.
How many people have died on New Zealand roads in 2026?
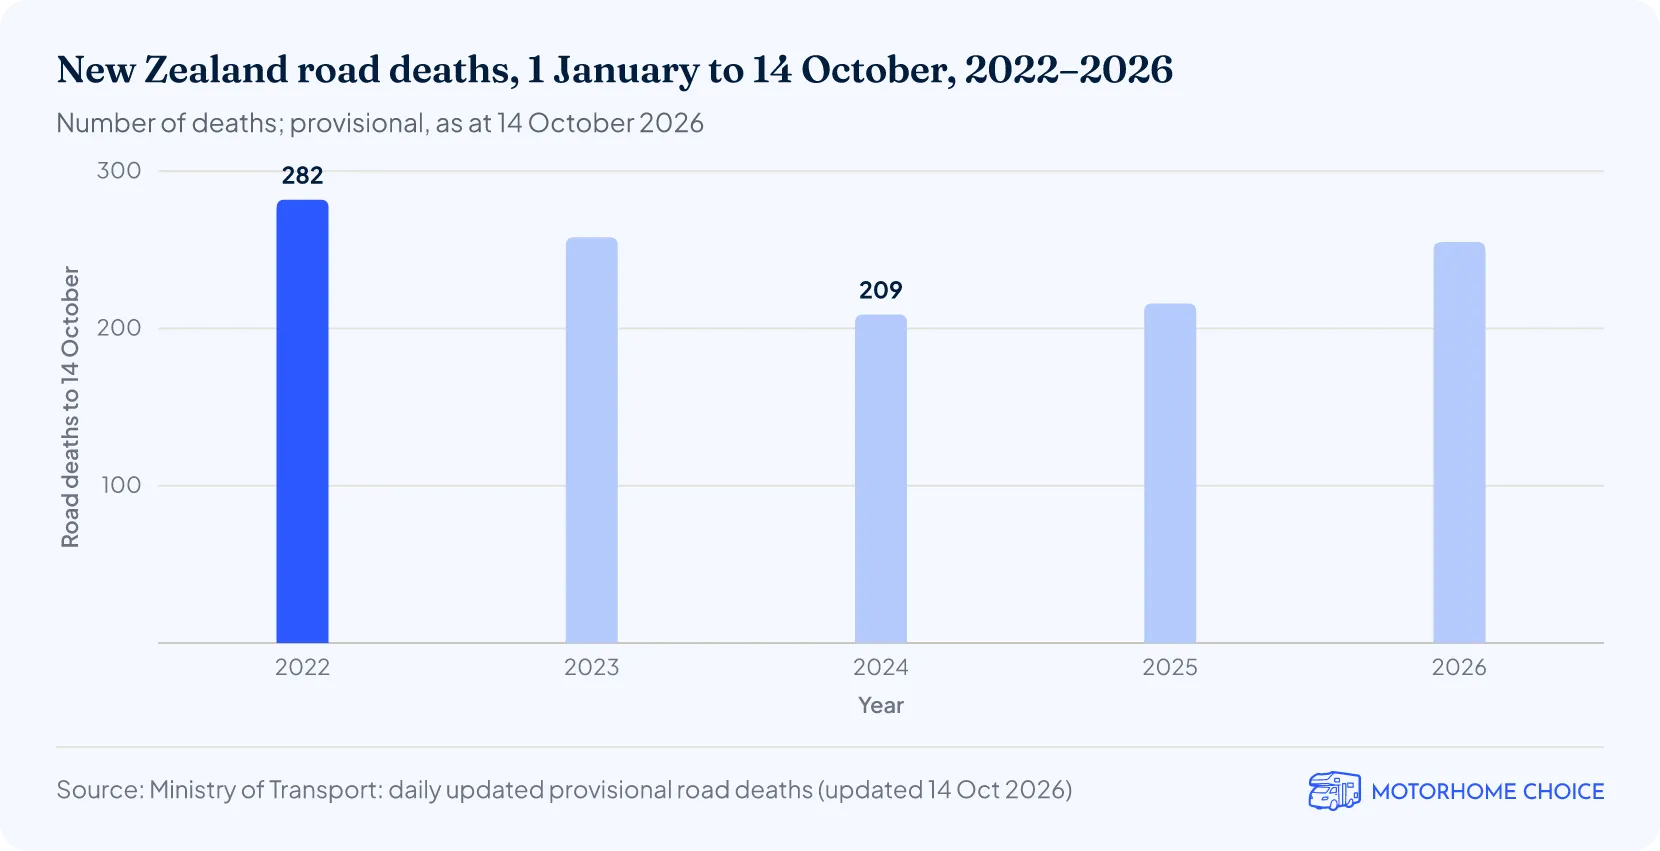
255 people died on New Zealand roads between 1 January and 14 October 2026, according to the Ministry of Transport's daily provisional count1. That is 39 more than the 216 deaths recorded over the same dates in 2025, an increase of 18%. Much of the gap opened in August and September: 51 people died in those two months of 2026, against 22 in 2025.
The 2026 count is higher than at the same point in 2024 (209) and 2025, but lower than in 2022 (282) and 2023 (258)1.
What is New Zealand's road toll by year?
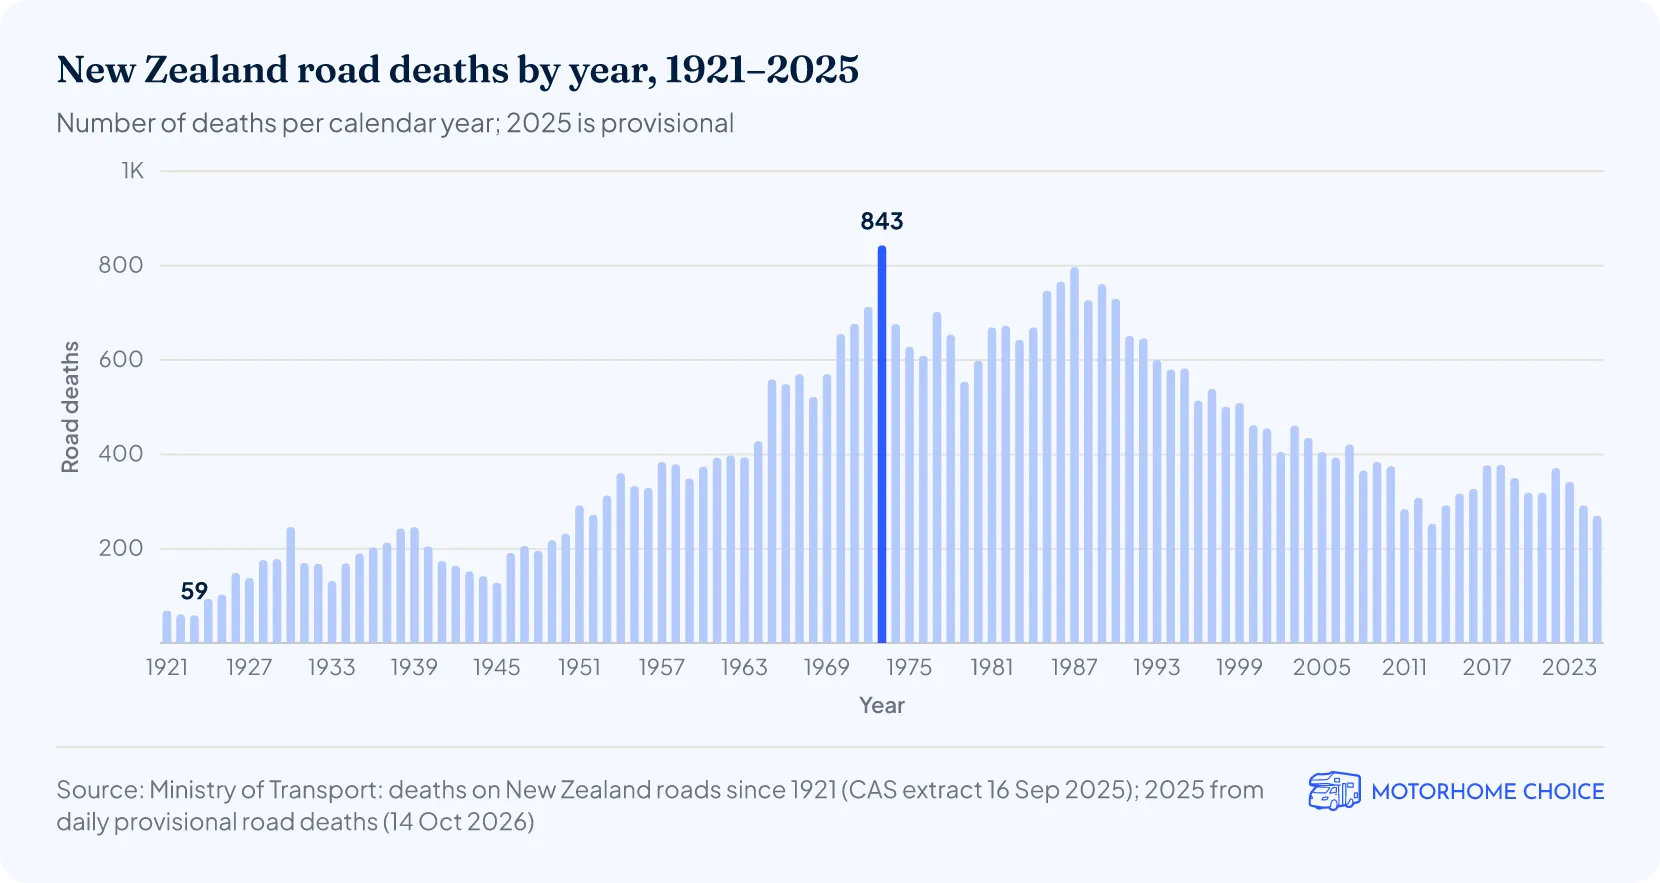
New Zealand's highest road toll was 843 deaths in 19733. The annual toll rose from 69 in 1921 as car ownership spread, passed 500 a year in 1965 and stayed above 500 until 1999.
It has fallen since the late 1980s, though not in a straight line: it rose from 253 in 2013 to 378 in 20183. The 2025 toll of 270 was 573 deaths, or 68%, below the 1973 peak. Every year from 2014 to 2024 recorded 292 deaths or more.
How many road deaths are there per 100,000 people in New Zealand?
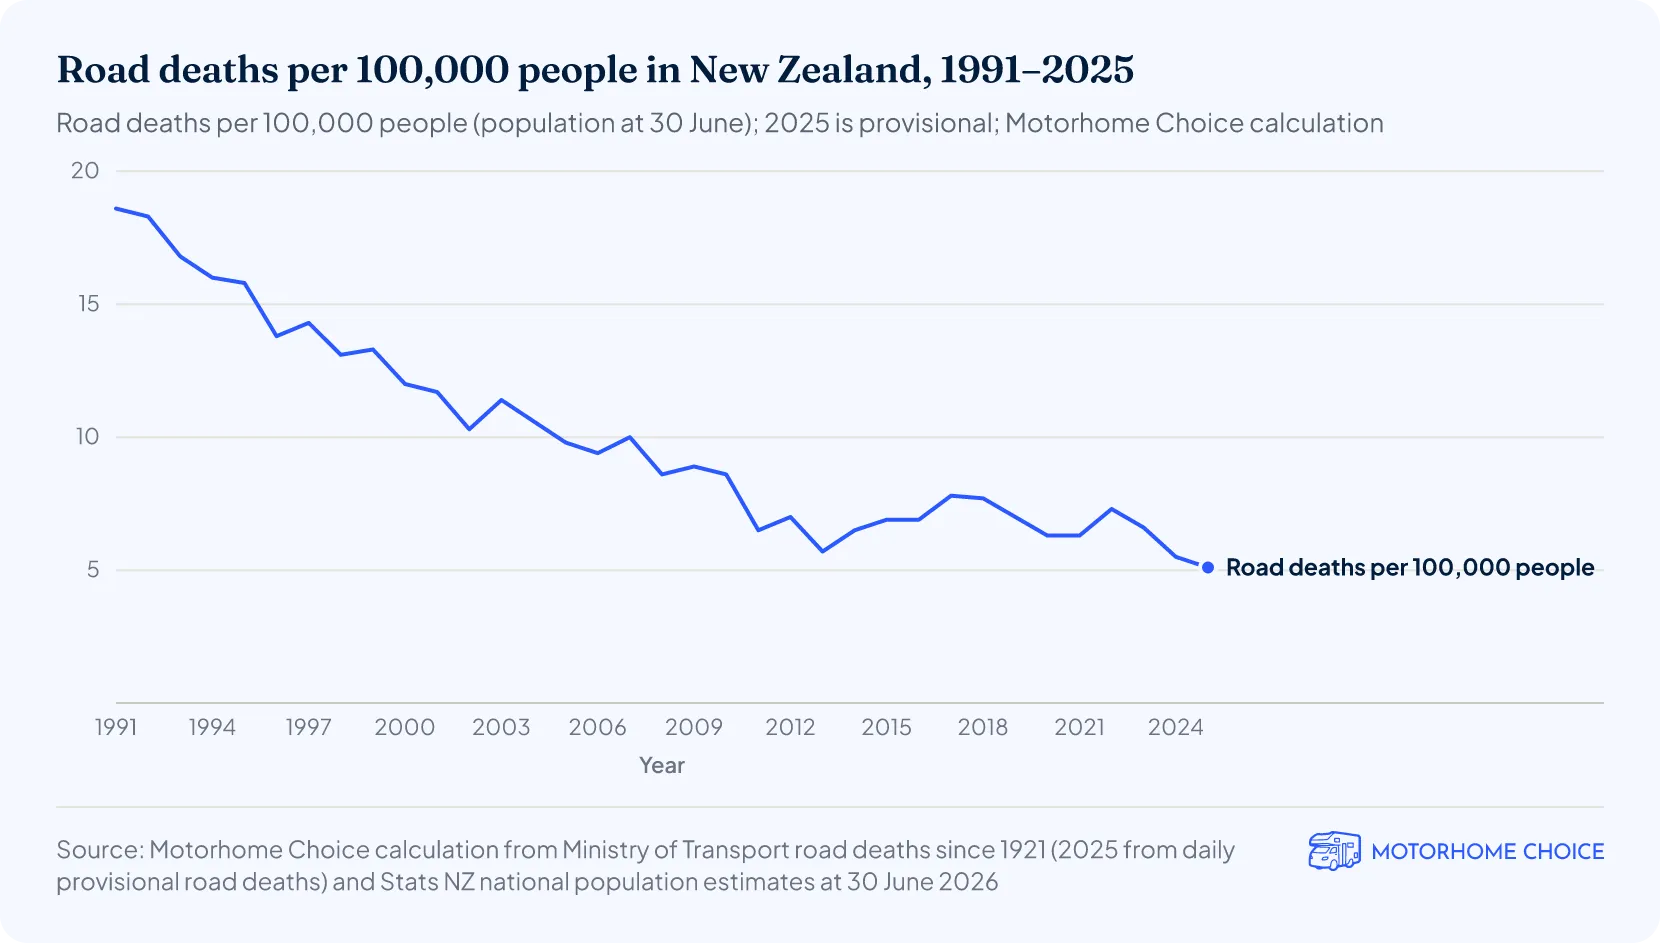
New Zealand recorded 5.1 road deaths per 100,000 people in 2025, the lowest rate in any year since at least 1991 (our calculation)2. In 1991 the rate was 18.6.
Between 1991 and 2025 New Zealand's population grew by 52%, from about 3.50 million to 5.32 million2, while annual road deaths fell by 59%, from 651 to 2703.
| Road deaths and deaths per 100,000 people in New Zealand, 2016–2025 | |||
|---|---|---|---|
| Year | Road deaths | Population at 30 June | Deaths per 100,000 people |
| 2016 | 327 | 4,714,100 | 6.9 |
| 2017 | 377 | 4,813,500 | 7.8 |
| 2018 | 378 | 4,900,500 | 7.7 |
| 2019 | 350 | 4,970,400 | 7.0 |
| 2020 | 319 | 5,072,400 | 6.3 |
| 2021 | 319 | 5,084,400 | 6.3 |
| 2022 | 371 | 5,081,800 | 7.3 |
| 2023 | 342 | 5,200,100 | 6.6 |
| 2024 | 292 | 5,290,000 | 5.5 |
| 2025 | 270 | 5,321,000 | 5.1 |
Source · Ministry of Transport (road deaths since 1921; 2025 from daily provisional road deaths, 14 October 2026); Stats NZ, National population estimates: At 30 June 2026.
Which regions of New Zealand have the most road deaths?
Waikato had the most road deaths of any region in 2025, with 62, followed by Auckland (38) and Canterbury (32), according to the Ministry of Transport's provisional figures1.
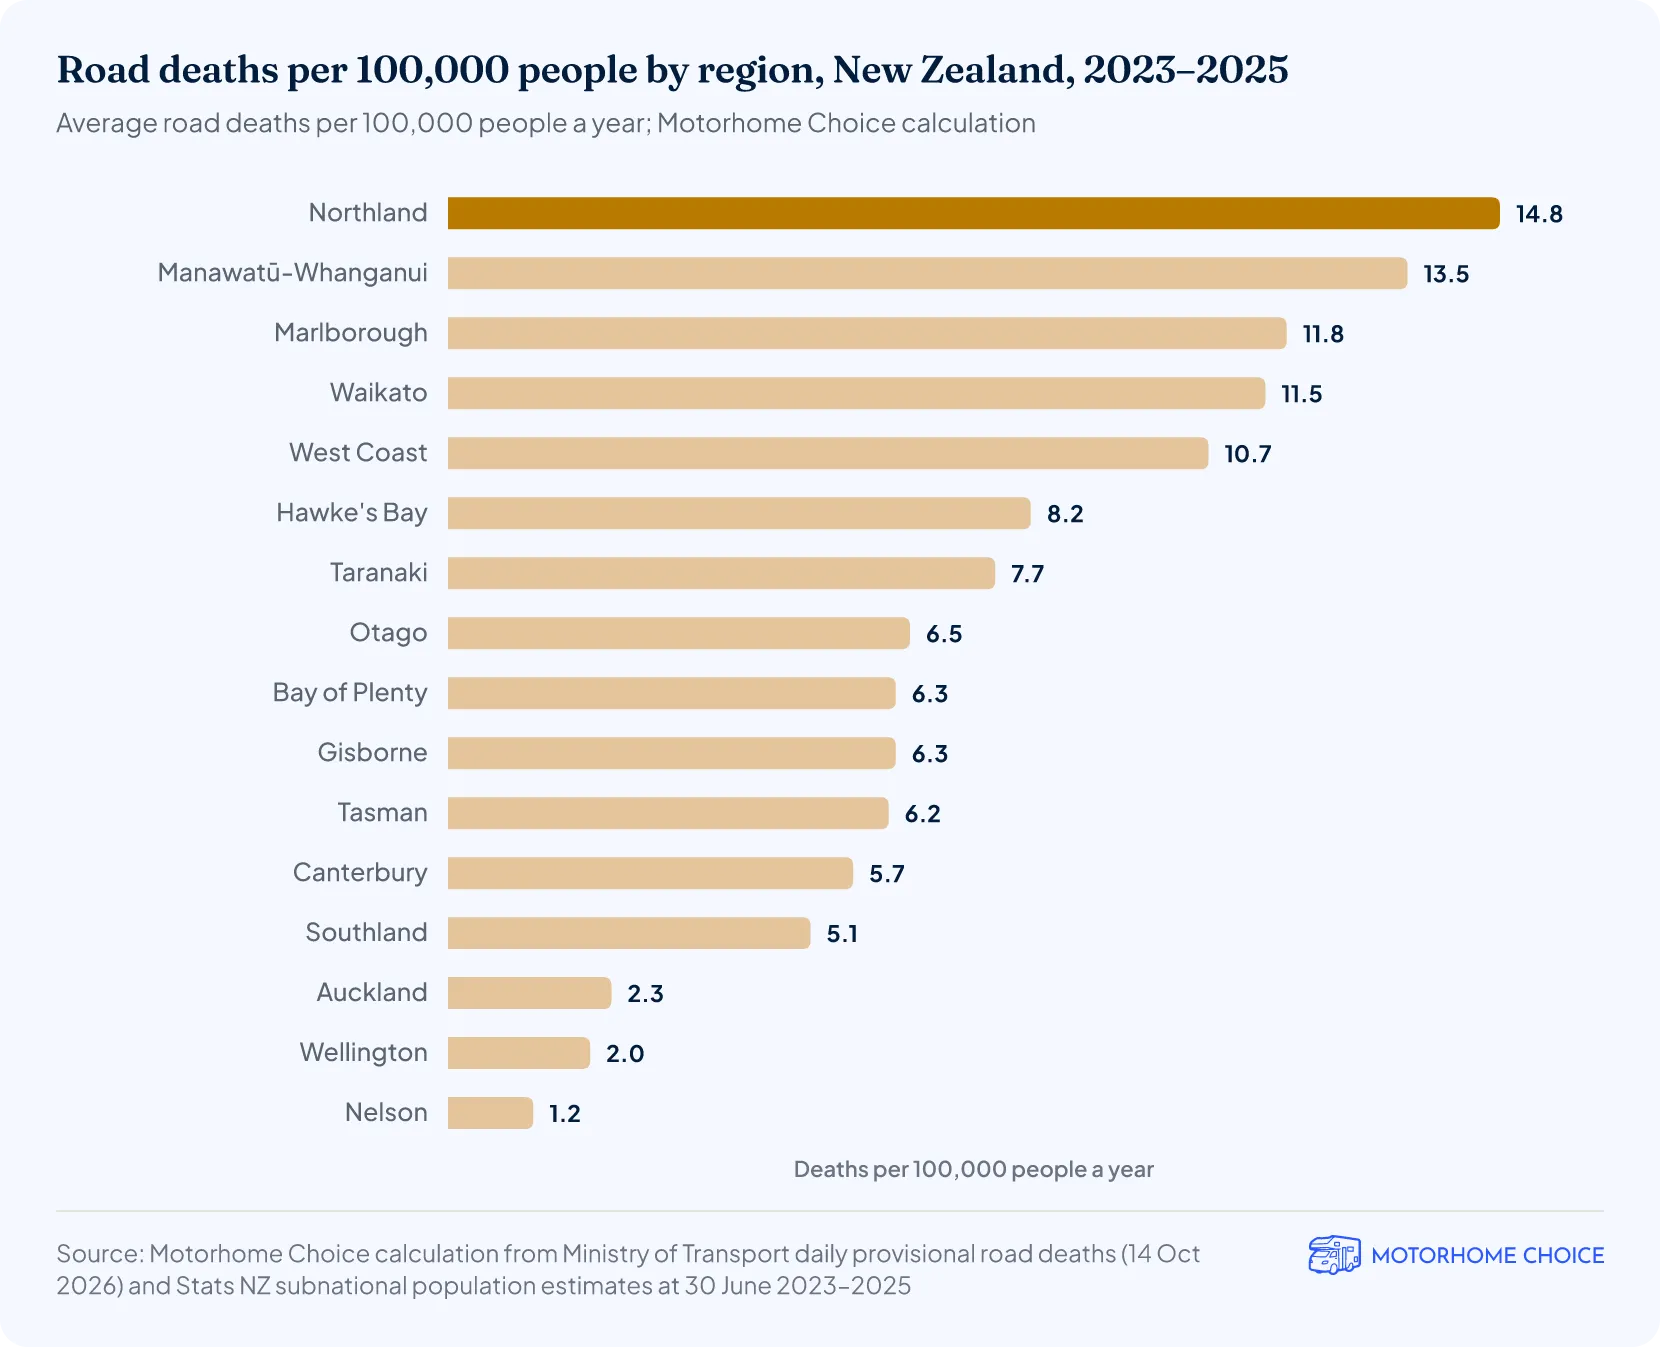
Measured against population, Northland has the highest rate. Over 2023–2025 it averaged 14.8 road deaths per 100,000 people a year, followed by Manawatū-Whanganui (Manawatu-Whanganui) at 13.5 and Marlborough at 11.8 (our calculation)6. Auckland (2.3) and Wellington (2.0) have some of the lowest rates. Small regions can swing sharply from year to year: Marlborough's high rate rests on 12 deaths in 2024, against 3 in each of 2023 and 20251.
| Road deaths by region in New Zealand, 2023–2025 | ||||
|---|---|---|---|---|
| Region | 2023 | 2024 | 2025 | Deaths per 100,000 people a year, 2023–2025 |
| Northland | 38 | 27 | 24 | 14.8 |
| Manawatū-Whanganui | 39 | 35 | 31 | 13.5 |
| Marlborough | 3 | 12 | 3 | 11.8 |
| Waikato | 66 | 53 | 62 | 11.5 |
| West Coast | 4 | 6 | 1 | 10.7 |
| Hawke's Bay | 12 | 13 | 19 | 8.2 |
| Taranaki | 12 | 9 | 9 | 7.7 |
| Otago | 20 | 14 | 15 | 6.5 |
| Bay of Plenty | 24 | 24 | 18 | 6.3 |
| Gisborne | 4 | 6 | 0 | 6.3 |
| Tasman | 3 | 5 | 3 | 6.2 |
| Canterbury | 46 | 39 | 32 | 5.7 |
| Southland | 8 | 3 | 5 | 5.1 |
| Auckland | 47 | 36 | 38 | 2.3 |
| Wellington | 15 | 7 | 10 | 2.0 |
| Nelson | 1 | 1 | 0 | 1.2 |
| New Zealand | 342 | 290 | 270 | 5.7 |
Source · Ministry of Transport, daily updated provisional road deaths (updated 14 October 2026), deaths by region; Stats NZ, Subnational population estimates: At 30 June 2025. 2024 regional figures total 290; the historical series gives 292.
Who dies on New Zealand roads?
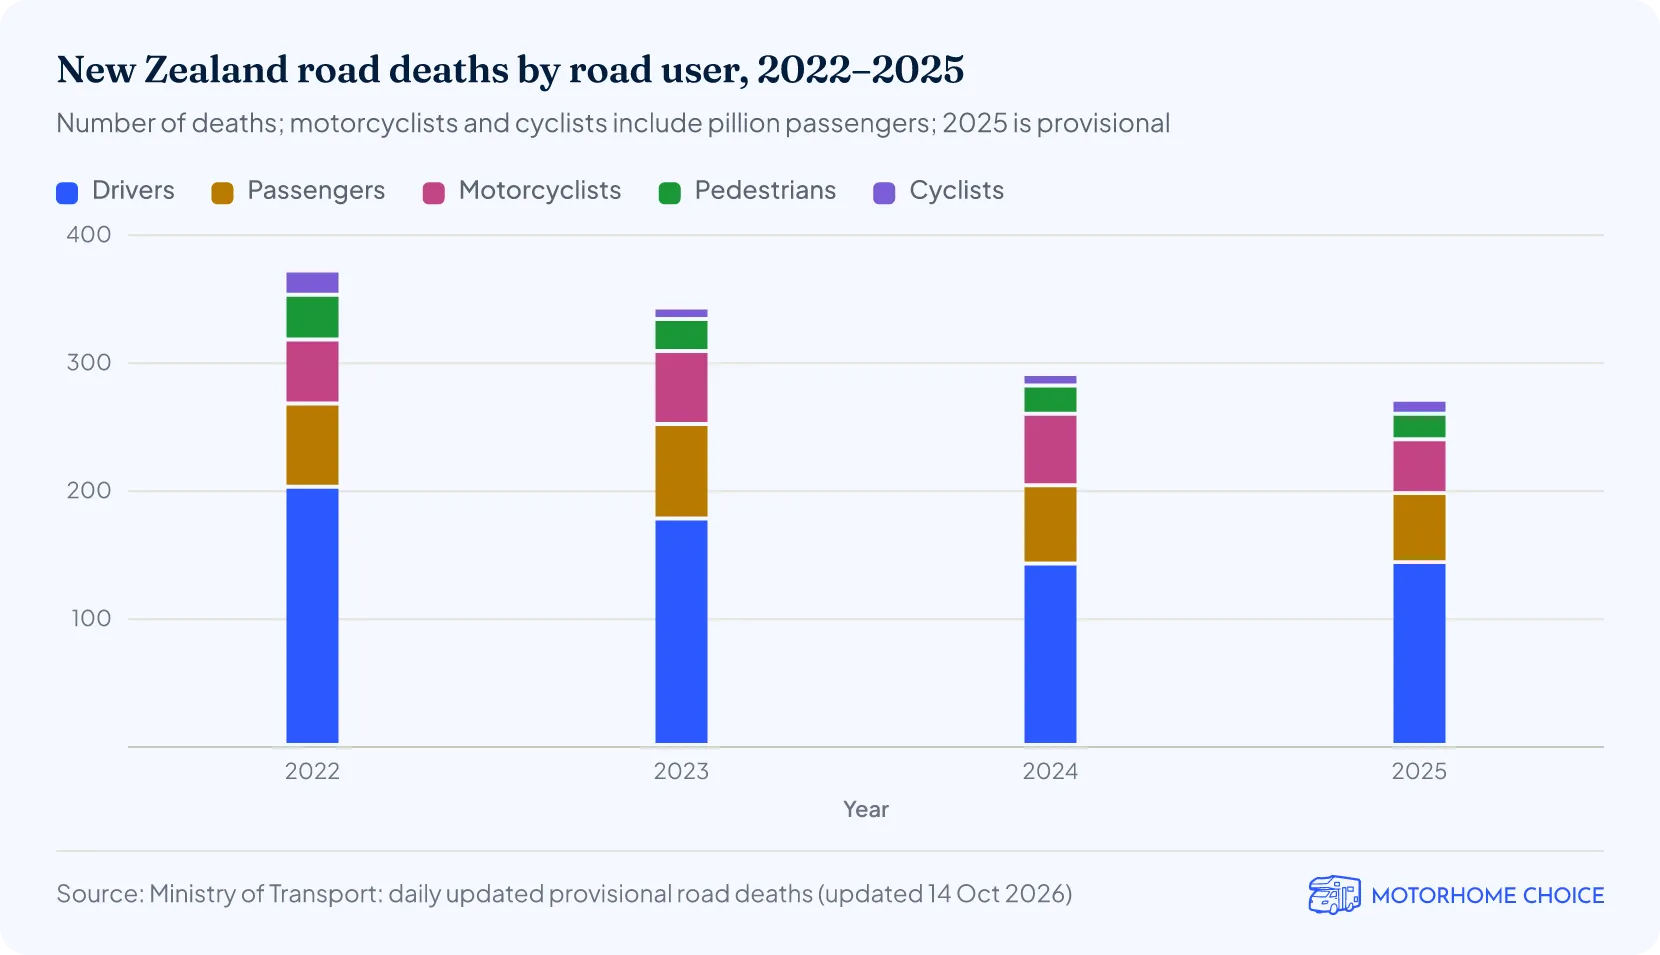
Drivers made up 143 of the 270 road deaths in 2025 (53%), according to the Ministry of Transport1. Passengers accounted for 54 deaths, motorcyclists and their pillion passengers 42, pedestrians 20, and cyclists and their passengers 11.
Nearly three in four people killed in 2025 were male: 196 of 2701.
How many people die on New Zealand roads over Christmas and New Year?
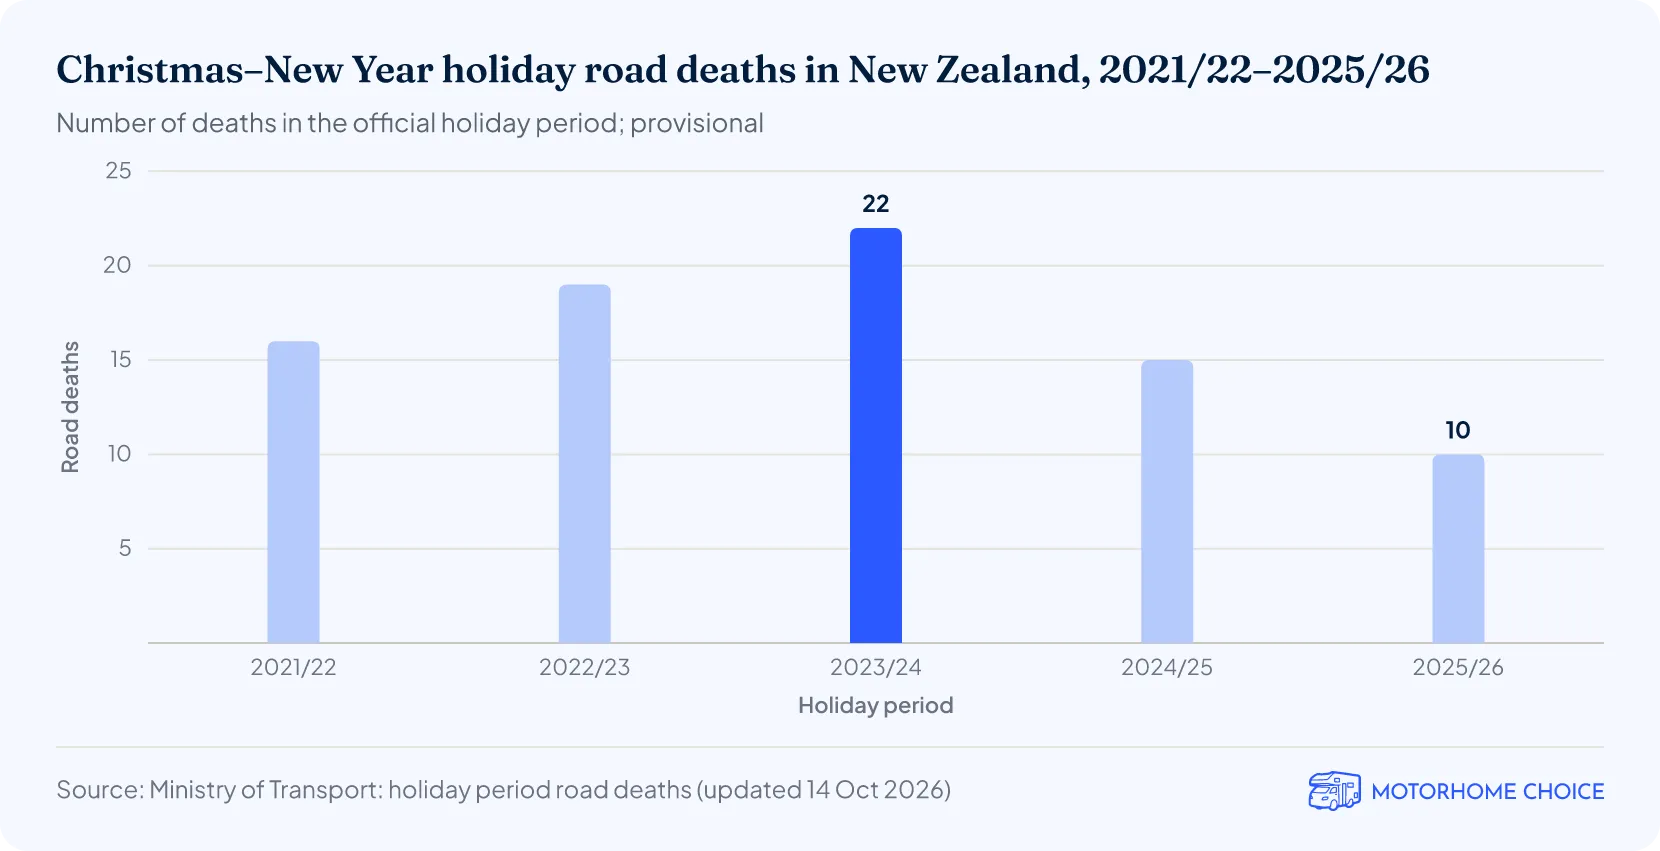
10 people died on New Zealand roads over the 2025/26 Christmas–New Year holiday period, which ran from 4pm on 24 December 2025 to 6am on 5 January 20268. That was down from 15 in 2024/25 and 22 in 2023/24, according to the Ministry of Transport4.
The highest Christmas–New Year toll since records began in 1956/57 is 37 deaths, in 1972/73, according to NZ Police5. The official period usually starts at 4pm on Christmas Eve and ends at 6am on 3, 4 or 5 January, depending on where the public holidays fall1.
How many people die over other holiday weekends in New Zealand?
Seven people died over King's Birthday (the Sovereign's Birthday) weekend in 2026 (provisional), the most of any official holiday period so far that year, according to the Ministry of Transport4. Easter 2026 had three deaths and Matariki two.
Easter runs from 4pm on the Thursday to 6am on the Tuesday; Sovereign's Birthday and Labour Weekend from 4pm on the Friday to 6am on the Tuesday; Matariki, a public holiday since 2022, from 4pm on the Thursday to 6am on the Monday1.
| Road deaths over New Zealand's official holiday periods, 2022–2026 | |||||
|---|---|---|---|---|---|
| Holiday period | 2022 | 2023 | 2024 | 2025 | 2026 (as at 14 October) |
| Easter | 5 | 1 | 7 | 4 | 3 |
| Sovereign's (King's) Birthday | 2 | 4 | 3 | 5 | 7 |
| Matariki | 6 | 2 | 3 | 1 | 2 |
| Labour Weekend | 5 | 5 | 0 | 2 | Not yet |
| Christmas–New Year (starting December) | 19 | 22 | 15 | 10 | Not yet |
Source · Ministry of Transport, holiday period road deaths (updated 14 October 2026). Provisional figures. The Christmas–New Year column is the period beginning in December of that year.
More New Zealand facts & statistics
Campervan hire in New Zealand
References
- Daily updated provisional road deaths (Ministry of Transport, updated 14 Oct 2026)mot-analytics.gitlab.ioPublished 2026-10-14 · Retrieved 2026-10-14
- National population estimates: At 30 June 2026stats.govt.nzPublished 2026-08-18 · Retrieved 2026-10-14
- A historical time series of deaths on New Zealand roads since 1921 (Ministry of Transport)mot-analytics.gitlab.ioPublished 2025-09-16 · Retrieved 2026-10-14
- Holiday period road deaths (Ministry of Transport, updated 14 Oct 2026)mot-analytics.gitlab.ioPublished 2026-10-14 · Retrieved 2026-10-14
- Holiday road toll lowest since records began (NZ Police media release, 3 January 2013)police.govt.nzPublished 2013-01-03 · Retrieved 2026-10-14
- Subnational population estimates: At 30 June 2025stats.govt.nzPublished 2025-10-29 · Retrieved 2026-10-14
- Road deaths over the holiday period: frequently asked questions (Ministry of Transport, 2026)transport.govt.nzRetrieved 2026-10-14
- Holiday periods: official holiday period dates (Ministry of Transport)transport.govt.nzRetrieved 2026-10-14